| . |
. |
Comparsion of voting results per candidates |
. |
. |
| . |
. |
| . |
. |
. |
. |
. |
. |
. |
. |
. |
. |
. |
. |
. |
. |
. |
. |
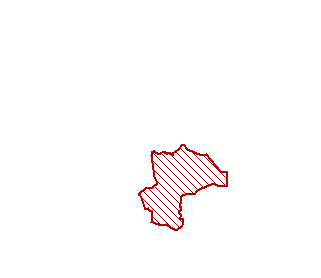
| Polska / małopolskie / bocheński / Nowy Wiśnicz, gm. |
 |
| Nowy Wiśnicz, gm. |
| Statistics on 04.07.2010 |
| Population: |
13149 |
| Area: |
82.49 km2 |
| Population density: |
159 os/km2 |
| Summary voting results |
| Number of people entitled to vote: |
10464 |
| Number of ballot papers issued: |
6512 |
| Total votes: |
6511 |
| Number of valid votes: |
6462 |
|
| lack |
50.00% |
>50.00% |
≥53.31% |
≥56.62% |
≥59.93% |
≥63.24% |
≥66.55% |
≥69.86% |
≥73.17% |
≥76.48% |
≥79.79% |
 |
 |
 |
 |
 |
 |
 |
 |
 |
 |
 |
 |
 |
 |
 |
 |
 |
 |
 |
 |
 |
 |
 |
 |
| of data |
50.00% |
>50.00% |
≥53.31% |
≥56.62% |
≥59.93% |
≥63.24% |
≥66.55% |
≥69.86% |
≥73.17% |
≥76.48% |
≥79.79% |
|
See also:
Detailed voting results per candidates:
|
|
| . |
. |
Comparsion of voting results per candidates |
. |
. |
| . |
. |
| . |
. |
. |
. |
. |
. |
. |
. |
. |
. |
. |
. |
| No. |
Name |
No. of
valid votes |
KACZYŃSKI Jarosław Aleksander |
No. of votes:
per candidate / valid
[%] |
KOMOROWSKI Bronisław Maria |
| votes per candidate |
votes per candidate |
| number |
% |
% |
number |
| 1 |
Remiza OSP, Królówka 315 |
946 |
801 |
84.67 |
 |
15.33 |
145 |
| 2 |
Zespół Szkół, ul.Kościelna 2, Nowy Wiśnicz |
1377 |
860 |
62.45 |
 |
37.55 |
517 |
| 3 |
Świetlica Wiejska, Połom Duży 85 |
281 |
213 |
75.80 |
 |
24.20 |
68 |
| 4 |
Dom Ludowy, Muchówka 157 |
484 |
427 |
88.22 |
 |
11.78 |
57 |
| 5 |
Zespół Szkół, Stary Wiśnicz 480 |
1211 |
901 |
74.40 |
 |
25.60 |
310 |
| 6 |
Zespół Szkół, Kobyle 81 |
570 |
375 |
65.79 |
 |
34.21 |
195 |
| 7 |
Szkoła Podstawowa, Chronów 173 |
207 |
154 |
74.40 |
 |
25.60 |
53 |
| 8 |
Zespół Szkół, ul.Kościelna 2, Nowy Wiśnicz |
1093 |
751 |
68.71 |
 |
31.29 |
342 |
| 9 |
Zakład Karny,Nowy Wiśnicz |
293 |
19 |
6.48 |
 |
93.52 |
274 |
| Σ |
Nowy Wiśnicz, gm. |
6462 |
4501 |
69.65 |
 |
30.35 |
1961 |
|
| |
|
 First ballotLegal ActsDocumentsElectoral BodiesCandidatesTurnoutResultsSearchCreated by
 First ballotLegal ActsDocumentsElectoral BodiesCandidatesTurnoutResultsSearchCreated by