| . |
. |
Comparsion of voting results per candidates |
. |
. |
| . |
. |
| . |
. |
. |
. |
. |
. |
. |
. |
. |
. |
. |
. |
. |
. |
. |
. |
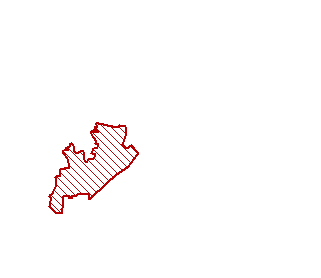
| Polska / lubelskie / bialski / Drelów, gm. |
 |
| Drelów, gm. |
| Statistics on 04.07.2010 |
| Population: |
5662 |
| Area: |
228.03 km2 |
| Population density: |
24 os/km2 |
| Summary voting results |
| Number of people entitled to vote: |
4374 |
| Number of ballot papers issued: |
2136 |
| Total votes: |
2136 |
| Number of valid votes: |
2102 |
|
| lack |
50.00% |
>50.00% |
≥53.00% |
≥56.00% |
≥59.00% |
≥62.00% |
≥65.00% |
≥68.00% |
≥71.00% |
≥74.00% |
≥77.00% |
 |
 |
 |
 |
 |
 |
 |
 |
 |
 |
 |
 |
 |
 |
 |
 |
 |
 |
 |
 |
 |
 |
 |
 |
| of data |
50.00% |
>50.00% |
≥53.00% |
≥56.00% |
≥59.00% |
≥62.00% |
≥65.00% |
≥68.00% |
≥71.00% |
≥74.00% |
≥77.00% |
|
See also:
Detailed voting results per candidates:
|
|
| . |
. |
Comparsion of voting results per candidates |
. |
. |
| . |
. |
| . |
. |
. |
. |
. |
. |
. |
. |
. |
. |
. |
. |
| No. |
Name |
No. of
valid votes |
KACZYŃSKI Jarosław Aleksander |
No. of votes:
per candidate / valid
[%] |
KOMOROWSKI Bronisław Maria |
| votes per candidate |
votes per candidate |
| number |
% |
% |
number |
| 1 |
Szkoła Podstawowa w Drelowie, ul. Szkolna 11, Drelów |
821 |
529 |
64.43 |
 |
35.57 |
292 |
| 2 |
Szkoła Podstawowa w Dołdze, Dołha 1, Dołha |
394 |
310 |
78.68 |
 |
21.32 |
84 |
| 3 |
Szkoła Podstawowa w Szóstce, Szóstka 8 , Szóstka |
425 |
286 |
67.29 |
 |
32.71 |
139 |
| 4 |
Szkoła Podstawowa w Żerocinie, Żerocin 32, Żerocin |
260 |
184 |
70.77 |
 |
29.23 |
76 |
| 5 |
Szkoła Podstawowa w Witorożu, Witoroż 2, Witoroż |
202 |
145 |
71.78 |
 |
28.22 |
57 |
| Σ |
Drelów, gm. |
2102 |
1454 |
69.17 |
 |
30.83 |
648 |
|
| |
|
 First ballotLegal ActsDocumentsElectoral BodiesCandidatesTurnoutResultsSearchCreated by
 First ballotLegal ActsDocumentsElectoral BodiesCandidatesTurnoutResultsSearchCreated by