|
See also:
|
| . |
. |
Number of people entitled to vote, Number of ballot papers issued |
. |
. |
| . |
. |
| . |
. |
. |
. |
. |
. |
. |
. |
. |
. |
. |
. |
| No. |
Name |
No. of polling |
No. of people
entitled to vote |
No. of
ballot papers
issued |
No. of: ballot papers issued / entitled to vote [%] |
| wards |
wards which
transmitted the results |
| 201201 | Bakałarzewo, gm. | 4 | 4 | 2553 | 991 | 38.82 |  |
| 201202 | Filipów, gm. | 3 | 3 | 3751 | 1393 | 37.14 | |
| 201203 | Jeleniewo, gm. | 2 | 2 | 2557 | 1204 | 47.09 | |
| 201204 | Przerośl, gm. | 4 | 4 | 2392 | 851 | 35.58 | |
| 201205 | Raczki, gm. | 3 | 3 | 4787 | 2003 | 41.84 | |
| 201206 | Rutka-Tartak, gm. | 2 | 2 | 2056 | 935 | 45.48 | |
| 201207 | Suwałki, gm. | 5 | 5 | 5714 | 2437 | 42.65 | |
| 201208 | Szypliszki, gm. | 4 | 4 | 3224 | 1287 | 39.92 | |
| 201209 | Wiżajny, gm. | 2 | 2 | 2095 | 873 | 41.67 | |
| |
suwalski |
29 |
29 |
29129 |
11974 |
41.11 |
 |
|
| |
| . |
. |
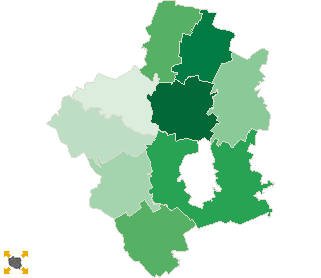
Turnout by location of ward electoral commission |
. |
. |
| . |
. |
| . |
. |
. |
. |
. |
. |
. |
. |
. |
. |
. |
. |
| No. |
Name |
No. of polling |
No. of people
entitled to vote |
No. of
ballot papers
issued |
No. of: ballot papers issued / entitled to vote [%] |
| wards |
wards which
transmitted the results |
| 1 | rural commune | 29 | 29 | 29129 | 11974 | 41.11 | |
|
|
 First ballotLegal ActsDocumentsElectoral BodiesCandidatesTurnoutResultsSearchCreated by