|
See also:
|
| . |
. |
Number of people entitled to vote, Number of ballot papers issued |
. |
. |
| . |
. |
| . |
. |
. |
. |
. |
. |
. |
. |
. |
. |
. |
. |
| No. |
Name |
No. of polling |
No. of people
entitled to vote |
No. of
ballot papers
issued |
No. of: ballot papers issued / entitled to vote [%] |
| wards |
wards which
transmitted the results |
| 100502 | Bielawy, gm. | 8 | 8 | 4833 | 1136 | 23.51 |  |
| 100503 | Chąśno, gm. | 3 | 3 | 2475 | 644 | 26.02 | |
| 100504 | Domaniewice, gm. | 3 | 3 | 3728 | 832 | 22.32 | |
| 100505 | Kiernozia, gm. | 3 | 3 | 2944 | 753 | 25.58 | |
| 100506 | Kocierzew Południowy, gm. | 3 | 3 | 3577 | 1086 | 30.36 | |
| 100507 | Łowicz, gm. | 8 | 8 | 5886 | 1469 | 24.96 | |
| 100501 | Łowicz, m. | 18 | 18 | 24698 | 6442 | 26.08 | |
| 100508 | Łyszkowice, gm. | 8 | 8 | 5383 | 1045 | 19.41 | |
| 100509 | Nieborów, gm. | 7 | 7 | 7592 | 1722 | 22.68 | |
| 100510 | Zduny, gm. | 4 | 4 | 4927 | 1241 | 25.19 | |
| |
łowicki |
65 |
65 |
66043 |
16370 |
24.79 |
 |
|
| |
| . |
. |
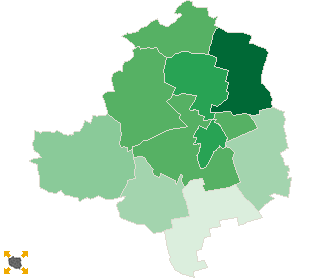
Turnout by location of ward electoral commission |
. |
. |
| . |
. |
| . |
. |
. |
. |
. |
. |
. |
. |
. |
. |
. |
. |
| No. |
Name |
No. of polling |
No. of people
entitled to vote |
No. of
ballot papers
issued |
No. of: ballot papers issued / entitled to vote [%] |
| wards |
wards which
transmitted the results |
| 1 | rural commune | 47 | 47 | 41345 | 9928 | 24.01 | |
| 2 | urban commune | 18 | 18 | 24698 | 6442 | 26.08 | |
|
|
 First ballotLegal ActsDocumentsElectoral BodiesCandidatesTurnoutResultsSearchCreated by