|
See also:
|
| . |
. |
Number of people entitled to vote, Number of ballot papers issued |
. |
. |
| . |
. |
| . |
. |
. |
. |
. |
. |
. |
. |
. |
. |
. |
. |
| No. |
Name |
No. of polling |
No. of people
entitled to vote |
No. of
ballot papers
issued |
No. of: ballot papers issued / entitled to vote [%] |
| wards |
wards which
transmitted the results |
| 160901 | Chrząstowice, gm. | 5 | 5 | 5377 | 162 | 3.01 |  |
| 160902 | Dąbrowa, gm. | 8 | 8 | 7516 | 142 | 1.89 | |
| 160903 | Dobrzeń Wielki, gm. | 13 | 13 | 11561 | 335 | 2.90 | |
| 160904 | Komprachcice, gm. | 7 | 7 | 8769 | 159 | 1.81 | |
| 160905 | Łubniany, gm. | 4 | 4 | 7656 | 204 | 2.66 | |
| 160906 | Murów, gm. | 5 | 5 | 4635 | 95 | 2.05 | |
| 160907 | Niemodlin, gm. | 11 | 11 | 10640 | 183 | 1.72 | |
| 160908 | Ozimek, gm. | 16 | 16 | 16825 | 414 | 2.46 | |
| 160909 | Popielów, gm. | 5 | 5 | 6815 | 188 | 2.76 | |
| 160910 | Prószków, gm. | 9 | 9 | 7776 | 267 | 3.43 | |
| 160911 | Tarnów Opolski, gm. | 8 | 8 | 7810 | 168 | 2.15 | |
| 160912 | Tułowice, gm. | 5 | 5 | 4288 | 74 | 1.73 | |
| 160913 | Turawa, gm. | 9 | 9 | 7697 | 136 | 1.77 | |
| |
opolski |
105 |
105 |
107365 |
2527 |
2.35 |
 |
|
| |
| . |
. |
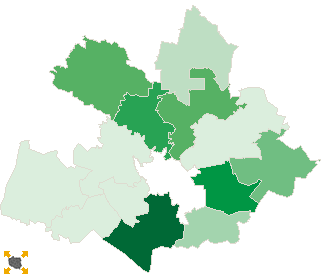
Turnout by location of ward electoral commission |
. |
. |
| . |
. |
| . |
. |
. |
. |
. |
. |
. |
. |
. |
. |
. |
. |
| No. |
Name |
No. of polling |
No. of people
entitled to vote |
No. of
ballot papers
issued |
No. of: ballot papers issued / entitled to vote [%] |
| wards |
wards which
transmitted the results |
| 1 | rural commune | 69 | 69 | 72124 | 1663 | 2.31 | |
| 2 | urban - rural commune | 36 | 36 | 35241 | 864 | 2.45 | |
|
|
 First ballotLegal ActsDocumentsElectoral BodiesCandidatesTurnoutResultsSearchCreated by