|
See also:
|
| . |
. |
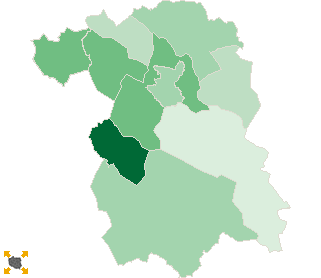
Number of people entitled to vote, Number of ballot papers issued |
. |
. |
| . |
. |
| . |
. |
. |
. |
. |
. |
. |
. |
. |
. |
. |
. |
| No. |
Name |
No. of polling |
No. of people
entitled to vote |
No. of
ballot papers
issued |
No. of: ballot papers issued / entitled to vote [%] |
| wards |
wards which
transmitted the results |
| 120502 | Biecz, gm. | 13 | 13 | 13416 | 535 | 3.99 |  |
| 120503 | Bobowa, gm. | 8 | 8 | 6878 | 415 | 6.03 | |
| 120504 | Gorlice, gm. | 11 | 11 | 12917 | 785 | 6.08 | |
| 120501 | Gorlice, m. | 22 | 22 | 23834 | 940 | 3.94 | |
| 120505 | Lipinki, gm. | 7 | 7 | 5384 | 178 | 3.31 | |
| 120506 | Łużna, gm. | 7 | 7 | 6375 | 369 | 5.79 | |
| 120507 | Moszczenica, gm. | 3 | 3 | 3673 | 126 | 3.43 | |
| 120508 | Ropa, gm. | 4 | 4 | 3822 | 394 | 10.31 | |
| 120509 | Sękowa, gm. | 6 | 6 | 3801 | 80 | 2.10 | |
| 120510 | Uście Gorlickie, gm. | 10 | 10 | 4947 | 220 | 4.45 | |
| |
gorlicki |
91 |
91 |
85047 |
4042 |
4.75 |
 |
|
| |
| . |
. |
Turnout by location of ward electoral commission |
. |
. |
| . |
. |
| . |
. |
. |
. |
. |
. |
. |
. |
. |
. |
. |
. |
| No. |
Name |
No. of polling |
No. of people
entitled to vote |
No. of
ballot papers
issued |
No. of: ballot papers issued / entitled to vote [%] |
| wards |
wards which
transmitted the results |
| 1 | rural commune | 48 | 48 | 40919 | 2152 | 5.26 | |
| 2 | urban - rural commune | 21 | 21 | 20294 | 950 | 4.68 | |
| 3 | urban commune | 22 | 22 | 23834 | 940 | 3.94 | |
|
|
 First ballotLegal ActsDocumentsElectoral BodiesCandidatesTurnoutResultsSearchCreated by