|
See also:
|
| . |
. |
Number of people entitled to vote, Number of ballot papers issued |
. |
. |
| . |
. |
| . |
. |
. |
. |
. |
. |
. |
. |
. |
. |
. |
. |
| No. |
Name |
No. of polling |
No. of people
entitled to vote |
No. of
ballot papers
issued |
No. of: ballot papers issued / entitled to vote [%] |
| wards |
wards which
transmitted the results |
| 241603 | Irządze, gm. | 3 | 3 | 2330 | 752 | 32.27 |  |
| 241604 | Kroczyce, gm. | 5 | 5 | 5079 | 1839 | 36.21 | |
| 241605 | Łazy, gm. | 10 | 10 | 13323 | 5576 | 41.85 | |
| 241606 | Ogrodzieniec, gm. | 6 | 6 | 7934 | 2919 | 36.79 | |
| 241607 | Pilica, gm. | 7 | 7 | 7462 | 2529 | 33.89 | |
| 241601 | Poręba, m. | 5 | 5 | 7307 | 2848 | 38.98 | |
| 241608 | Szczekociny, gm. | 9 | 9 | 6912 | 2372 | 34.32 | |
| 241609 | Włodowice, gm. | 4 | 4 | 4386 | 1427 | 32.54 | |
| 241602 | Zawiercie, m. | 34 | 34 | 43598 | 17257 | 39.58 | |
| 241610 | Żarnowiec, gm. | 7 | 7 | 3895 | 1361 | 34.94 | |
| |
zawierciański |
90 |
90 |
102226 |
38880 |
38.03 |
 |
|
| |
| . |
. |
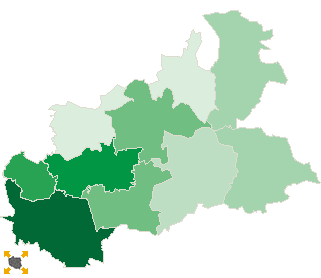
Turnout by location of ward electoral commission |
. |
. |
| . |
. |
| . |
. |
. |
. |
. |
. |
. |
. |
. |
. |
. |
. |
| No. |
Name |
No. of polling |
No. of people
entitled to vote |
No. of
ballot papers
issued |
No. of: ballot papers issued / entitled to vote [%] |
| wards |
wards which
transmitted the results |
| 1 | rural commune | 19 | 19 | 15690 | 5379 | 34.28 | |
| 2 | urban - rural commune | 32 | 32 | 35631 | 13396 | 37.60 | |
| 3 | urban commune | 39 | 39 | 50905 | 20105 | 39.50 | |
|
|
 Repeat ballotLegal ActsDocumentsElectoral BodiesCandidatesTurnoutResultsSearchCreated by