|
See also:
|
| . |
. |
Number of people entitled to vote, Number of ballot papers issued |
. |
. |
| . |
. |
| . |
. |
. |
. |
. |
. |
. |
. |
. |
. |
. |
. |
| No. |
Name |
No. of polling |
No. of people
entitled to vote |
No. of
ballot papers
issued |
No. of: ballot papers issued / entitled to vote [%] |
| wards |
wards which
transmitted the results |
| 120502 | Biecz, gm. | 13 | 13 | 13587 | 5485 | 40.37 |  |
| 120503 | Bobowa, gm. | 8 | 8 | 6958 | 3218 | 46.25 | |
| 120504 | Gorlice, gm. | 11 | 11 | 13074 | 5791 | 44.29 | |
| 120501 | Gorlice, m. | 22 | 22 | 24044 | 9540 | 39.68 | |
| 120505 | Lipinki, gm. | 7 | 7 | 5433 | 2295 | 42.24 | |
| 120506 | Łużna, gm. | 7 | 7 | 6430 | 2734 | 42.52 | |
| 120507 | Moszczenica, gm. | 3 | 3 | 3718 | 1413 | 38.00 | |
| 120508 | Ropa, gm. | 4 | 4 | 3879 | 2008 | 51.77 | |
| 120509 | Sękowa, gm. | 6 | 6 | 3902 | 1623 | 41.59 | |
| 120510 | Uście Gorlickie, gm. | 10 | 10 | 5174 | 2342 | 45.26 | |
| |
gorlicki |
91 |
91 |
86199 |
36449 |
42.28 |
 |
|
| |
| . |
. |
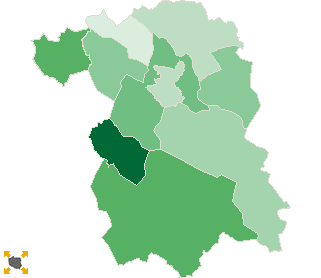
Turnout by location of ward electoral commission |
. |
. |
| . |
. |
| . |
. |
. |
. |
. |
. |
. |
. |
. |
. |
. |
. |
| No. |
Name |
No. of polling |
No. of people
entitled to vote |
No. of
ballot papers
issued |
No. of: ballot papers issued / entitled to vote [%] |
| wards |
wards which
transmitted the results |
| 1 | rural commune | 48 | 48 | 41610 | 18206 | 43.75 | |
| 2 | urban - rural commune | 21 | 21 | 20545 | 8703 | 42.36 | |
| 3 | urban commune | 22 | 22 | 24044 | 9540 | 39.68 | |
|
|
 Repeat ballotLegal ActsDocumentsElectoral BodiesCandidatesTurnoutResultsSearchCreated by