|
See also:
|
| . |
. |
Number of people entitled to vote, Number of ballot papers issued |
. |
. |
| . |
. |
| . |
. |
. |
. |
. |
. |
. |
. |
. |
. |
. |
. |
| No. |
Name |
No. of polling |
No. of people
entitled to vote |
No. of
ballot papers
issued |
No. of: ballot papers issued / entitled to vote [%] |
| wards |
wards which
transmitted the results |
| 241603 | Irządze, gm. | 3 | 3 | 2317 | 371 | 16.01 |  |
| 241604 | Kroczyce, gm. | 5 | 5 | 5049 | 988 | 19.57 | |
| 241605 | Łazy, gm. | 10 | 10 | 13297 | 2386 | 17.94 | |
| 241606 | Ogrodzieniec, gm. | 6 | 6 | 7911 | 1568 | 19.82 | |
| 241607 | Pilica, gm. | 7 | 7 | 7450 | 1475 | 19.80 | |
| 241601 | Poręba, m. | 5 | 5 | 7291 | 1292 | 17.72 | |
| 241608 | Szczekociny, gm. | 9 | 9 | 6889 | 1534 | 22.27 | |
| 241609 | Włodowice, gm. | 4 | 4 | 4367 | 698 | 15.98 | |
| 241602 | Zawiercie, m. | 34 | 34 | 43541 | 8520 | 19.57 | |
| 241610 | Żarnowiec, gm. | 7 | 7 | 3889 | 861 | 22.14 | |
| |
zawierciański |
90 |
90 |
102001 |
19693 |
19.31 |
 |
|
| |
| . |
. |
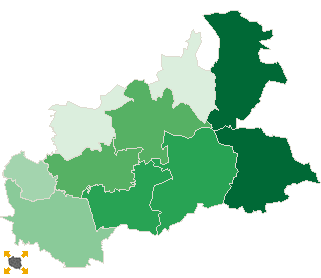
Turnout by location of ward electoral commission |
. |
. |
| . |
. |
| . |
. |
. |
. |
. |
. |
. |
. |
. |
. |
. |
. |
| No. |
Name |
No. of polling |
No. of people
entitled to vote |
No. of
ballot papers
issued |
No. of: ballot papers issued / entitled to vote [%] |
| wards |
wards which
transmitted the results |
| 1 | rural commune | 19 | 19 | 15622 | 2918 | 18.68 | |
| 2 | urban - rural commune | 32 | 32 | 35547 | 6963 | 19.59 | |
| 3 | urban commune | 39 | 39 | 50832 | 9812 | 19.30 | |
|
|
 Repeat ballotLegal ActsDocumentsElectoral BodiesCandidatesTurnoutResultsSearchCreated by