|
See also:
|
| . |
. |
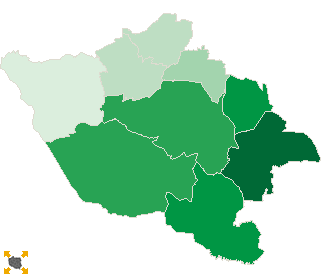
Number of people entitled to vote, Number of ballot papers issued |
. |
. |
| . |
. |
| . |
. |
. |
. |
. |
. |
. |
. |
. |
. |
. |
. |
| No. |
Name |
No. of polling |
No. of people
entitled to vote |
No. of
ballot papers
issued |
No. of: ballot papers issued / entitled to vote [%] |
| wards |
wards which
transmitted the results |
| 241505 | Godów, gm. | 8 | 8 | 10298 | 2619 | 25.43 |  |
| 241506 | Gorzyce, gm. | 15 | 15 | 16020 | 3922 | 24.48 | |
| 241507 | Lubomia, gm. | 7 | 7 | 6402 | 1183 | 18.48 | |
| 241508 | Marklowice, gm. | 3 | 3 | 4183 | 1087 | 25.99 | |
| 241509 | Mszana, gm. | 4 | 4 | 5676 | 1592 | 28.05 | |
| 241501 | Pszów, m. | 5 | 5 | 11545 | 2270 | 19.66 | |
| 241502 | Radlin, m. | 8 | 8 | 14184 | 3024 | 21.32 | |
| 241503 | Rydułtowy, m. | 14 | 14 | 17701 | 3608 | 20.38 | |
| 241504 | Wodzisław Śląski, m. | 29 | 29 | 39249 | 9738 | 24.81 | |
| |
wodzisławski |
93 |
93 |
125258 |
29043 |
23.19 |
 |
|
| |
| . |
. |
Turnout by location of ward electoral commission |
. |
. |
| . |
. |
| . |
. |
. |
. |
. |
. |
. |
. |
. |
. |
. |
. |
| No. |
Name |
No. of polling |
No. of people
entitled to vote |
No. of
ballot papers
issued |
No. of: ballot papers issued / entitled to vote [%] |
| wards |
wards which
transmitted the results |
| 1 | rural commune | 37 | 37 | 42579 | 10403 | 24.43 | |
| 2 | urban commune | 56 | 56 | 82679 | 18640 | 22.55 | |
|
|
 Repeat ballotLegal ActsDocumentsElectoral BodiesCandidatesTurnoutResultsSearchCreated by