|
See also:
|
| . |
. |
Number of people entitled to vote, Number of ballot papers issued |
. |
. |
| . |
. |
| . |
. |
. |
. |
. |
. |
. |
. |
. |
. |
. |
. |
| No. |
Name |
No. of polling |
No. of people
entitled to vote |
No. of
ballot papers
issued |
No. of: ballot papers issued / entitled to vote [%] |
| wards |
wards which
transmitted the results |
| 160901 | Chrząstowice, gm. | 5 | 5 | 5389 | 973 | 18.06 |  |
| 160902 | Dąbrowa, gm. | 8 | 8 | 7564 | 1226 | 16.21 | |
| 160903 | Dobrzeń Wielki, gm. | 13 | 13 | 11615 | 2129 | 18.33 | |
| 160904 | Komprachcice, gm. | 7 | 7 | 8885 | 1622 | 18.26 | |
| 160905 | Łubniany, gm. | 4 | 4 | 7679 | 1235 | 16.08 | |
| 160906 | Murów, gm. | 5 | 5 | 4673 | 843 | 18.04 | |
| 160907 | Niemodlin, gm. | 11 | 11 | 10748 | 1835 | 17.07 | |
| 160908 | Ozimek, gm. | 16 | 16 | 17009 | 2657 | 15.62 | |
| 160909 | Popielów, gm. | 5 | 5 | 6881 | 1158 | 16.83 | |
| 160910 | Prószków, gm. | 9 | 9 | 7845 | 1529 | 19.49 | |
| 160911 | Tarnów Opolski, gm. | 8 | 8 | 7853 | 1214 | 15.46 | |
| 160912 | Tułowice, gm. | 5 | 5 | 4354 | 829 | 19.04 | |
| 160913 | Turawa, gm. | 9 | 9 | 7768 | 1247 | 16.05 | |
| |
opolski |
105 |
105 |
108263 |
18497 |
17.09 |
 |
|
| |
| . |
. |
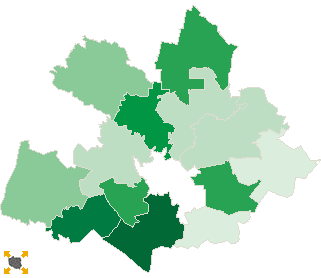
Turnout by location of ward electoral commission |
. |
. |
| . |
. |
| . |
. |
. |
. |
. |
. |
. |
. |
. |
. |
. |
. |
| No. |
Name |
No. of polling |
No. of people
entitled to vote |
No. of
ballot papers
issued |
No. of: ballot papers issued / entitled to vote [%] |
| wards |
wards which
transmitted the results |
| 1 | rural commune | 69 | 69 | 72661 | 12476 | 17.17 | |
| 2 | urban - rural commune | 36 | 36 | 35602 | 6021 | 16.91 | |
|
|
 Repeat ballotLegal ActsDocumentsElectoral BodiesCandidatesTurnoutResultsSearchCreated by