|
See also:
|
| . |
. |
Number of people entitled to vote, Number of ballot papers issued |
. |
. |
| . |
. |
| . |
. |
. |
. |
. |
. |
. |
. |
. |
. |
. |
. |
| No. |
Name |
No. of polling |
No. of people
entitled to vote |
No. of
ballot papers
issued |
No. of: ballot papers issued / entitled to vote [%] |
| wards |
wards which
transmitted the results |
| 120502 | Biecz, gm. | 13 | 13 | 13582 | 3646 | 26.84 |  |
| 120503 | Bobowa, gm. | 8 | 8 | 6948 | 2137 | 30.76 | |
| 120504 | Gorlice, gm. | 11 | 11 | 13059 | 3844 | 29.44 | |
| 120501 | Gorlice, m. | 22 | 22 | 23992 | 6363 | 26.52 | |
| 120505 | Lipinki, gm. | 7 | 7 | 5428 | 1412 | 26.01 | |
| 120506 | Łużna, gm. | 7 | 7 | 6427 | 1910 | 29.72 | |
| 120507 | Moszczenica, gm. | 3 | 3 | 3709 | 874 | 23.56 | |
| 120508 | Ropa, gm. | 4 | 4 | 3866 | 1477 | 38.20 | |
| 120509 | Sękowa, gm. | 6 | 6 | 3887 | 963 | 24.77 | |
| 120510 | Uście Gorlickie, gm. | 10 | 10 | 5113 | 1400 | 27.38 | |
| |
gorlicki |
91 |
91 |
86011 |
24026 |
27.93 |
 |
|
| |
| . |
. |
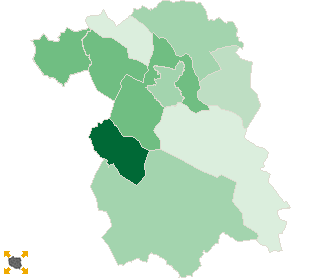
Turnout by location of ward electoral commission |
. |
. |
| . |
. |
| . |
. |
. |
. |
. |
. |
. |
. |
. |
. |
. |
. |
| No. |
Name |
No. of polling |
No. of people
entitled to vote |
No. of
ballot papers
issued |
No. of: ballot papers issued / entitled to vote [%] |
| wards |
wards which
transmitted the results |
| 1 | rural commune | 48 | 48 | 41489 | 11880 | 28.63 | |
| 2 | urban - rural commune | 21 | 21 | 20530 | 5783 | 28.17 | |
| 3 | urban commune | 22 | 22 | 23992 | 6363 | 26.52 | |
|
|
 Repeat ballotLegal ActsDocumentsElectoral BodiesCandidatesTurnoutResultsSearchCreated by