|
See also:
|
| . |
. |
Number of people entitled to vote, Number of ballot papers issued |
. |
. |
| . |
. |
| . |
. |
. |
. |
. |
. |
. |
. |
. |
. |
. |
. |
| No. |
Name |
No. of polling |
No. of people
entitled to vote |
No. of
ballot papers
issued |
No. of: ballot papers issued / entitled to vote [%] |
| wards |
wards which
transmitted the results |
| 160901 | Chrząstowice, gm. | 5 | 5 | 5384 | 129 | 2.40 |  |
| 160902 | Dąbrowa, gm. | 8 | 8 | 7550 | 85 | 1.13 | |
| 160903 | Dobrzeń Wielki, gm. | 13 | 13 | 11603 | 230 | 1.98 | |
| 160904 | Komprachcice, gm. | 7 | 7 | 8869 | 103 | 1.16 | |
| 160905 | Łubniany, gm. | 4 | 4 | 7679 | 122 | 1.59 | |
| 160906 | Murów, gm. | 5 | 5 | 4668 | 52 | 1.11 | |
| 160907 | Niemodlin, gm. | 11 | 11 | 10739 | 141 | 1.31 | |
| 160908 | Ozimek, gm. | 16 | 16 | 16964 | 283 | 1.67 | |
| 160909 | Popielów, gm. | 5 | 5 | 6868 | 123 | 1.79 | |
| 160910 | Prószków, gm. | 9 | 9 | 7844 | 192 | 2.45 | |
| 160911 | Tarnów Opolski, gm. | 8 | 8 | 7786 | 129 | 1.66 | |
| 160912 | Tułowice, gm. | 5 | 5 | 4351 | 53 | 1.22 | |
| 160913 | Turawa, gm. | 9 | 9 | 7757 | 92 | 1.19 | |
| |
opolski |
105 |
105 |
108062 |
1734 |
1.60 |
 |
|
| |
| . |
. |
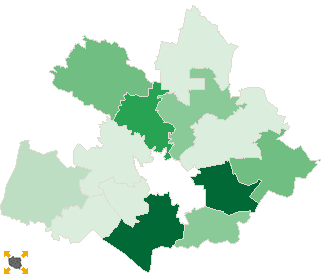
Turnout by location of ward electoral commission |
. |
. |
| . |
. |
| . |
. |
. |
. |
. |
. |
. |
. |
. |
. |
. |
. |
| No. |
Name |
No. of polling |
No. of people
entitled to vote |
No. of
ballot papers
issued |
No. of: ballot papers issued / entitled to vote [%] |
| wards |
wards which
transmitted the results |
| 1 | rural commune | 69 | 69 | 72515 | 1118 | 1.54 | |
| 2 | urban - rural commune | 36 | 36 | 35547 | 616 | 1.73 | |
|
|
 Repeat ballotLegal ActsDocumentsElectoral BodiesCandidatesTurnoutResultsSearchCreated by