|
See also:
|
| . |
. |
Number of people entitled to vote, Number of ballot papers issued |
. |
. |
| . |
. |
| . |
. |
. |
. |
. |
. |
. |
. |
. |
. |
. |
. |
| No. |
Name |
No. of polling |
No. of people
entitled to vote |
No. of
ballot papers
issued |
No. of: ballot papers issued / entitled to vote [%] |
| wards |
wards which
transmitted the results |
| 120502 | Biecz, gm. | 13 | 13 | 13558 | 302 | 2.23 |  |
| 120503 | Bobowa, gm. | 8 | 8 | 6947 | 292 | 4.20 | |
| 120504 | Gorlice, gm. | 11 | 11 | 13052 | 594 | 4.55 | |
| 120501 | Gorlice, m. | 22 | 22 | 23951 | 567 | 2.37 | |
| 120505 | Lipinki, gm. | 7 | 7 | 5421 | 98 | 1.81 | |
| 120506 | Łużna, gm. | 7 | 7 | 6422 | 351 | 5.47 | |
| 120507 | Moszczenica, gm. | 3 | 3 | 3705 | 66 | 1.78 | |
| 120508 | Ropa, gm. | 4 | 4 | 3861 | 347 | 8.99 | |
| 120509 | Sękowa, gm. | 6 | 6 | 3857 | 96 | 2.49 | |
| 120510 | Uście Gorlickie, gm. | 10 | 10 | 4938 | 188 | 3.81 | |
| |
gorlicki |
91 |
91 |
85712 |
2901 |
3.38 |
 |
|
| |
| . |
. |
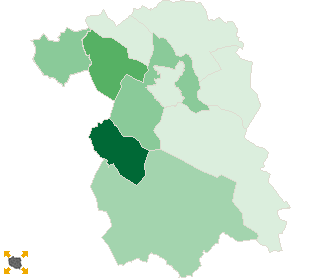
Turnout by location of ward electoral commission |
. |
. |
| . |
. |
| . |
. |
. |
. |
. |
. |
. |
. |
. |
. |
. |
. |
| No. |
Name |
No. of polling |
No. of people
entitled to vote |
No. of
ballot papers
issued |
No. of: ballot papers issued / entitled to vote [%] |
| wards |
wards which
transmitted the results |
| 1 | rural commune | 48 | 48 | 41256 | 1740 | 4.22 | |
| 2 | urban - rural commune | 21 | 21 | 20505 | 594 | 2.90 | |
| 3 | urban commune | 22 | 22 | 23951 | 567 | 2.37 | |
|
|
 Repeat ballotLegal ActsDocumentsElectoral BodiesCandidatesTurnoutResultsSearchCreated by