|
See also:
|
| . |
. |
Number of people entitled to vote, Number of ballot papers issued |
. |
. |
| . |
. |
| . |
. |
. |
. |
. |
. |
. |
. |
. |
. |
. |
. |
| No. |
Name |
No. of polling |
No. of people
entitled to vote |
No. of
ballot papers
issued |
No. of: ballot papers issued / entitled to vote [%] |
| wards |
wards which
transmitted the results |
| 241505 | Godów, gm. | 8 | 8 | 10279 | 4769 | 46.40 |  |
| 241506 | Gorzyce, gm. | 15 | 15 | 15970 | 6736 | 42.18 | |
| 241507 | Lubomia, gm. | 7 | 7 | 6486 | 2339 | 36.06 | |
| 241508 | Marklowice, gm. | 3 | 3 | 4097 | 1812 | 44.23 | |
| 241509 | Mszana, gm. | 4 | 4 | 5674 | 2813 | 49.58 | |
| 241501 | Pszów, m. | 5 | 5 | 11426 | 4601 | 40.27 | |
| 241502 | Radlin, m. | 8 | 8 | 13980 | 5801 | 41.49 | |
| 241503 | Rydułtowy, m. | 14 | 14 | 17553 | 7321 | 41.71 | |
| 241504 | Wodzisław Śląski, m. | 29 | 29 | 38944 | 16624 | 42.69 | |
| |
wodzisławski |
93 |
93 |
124409 |
52816 |
42.45 |
 |
|
| |
| . |
. |
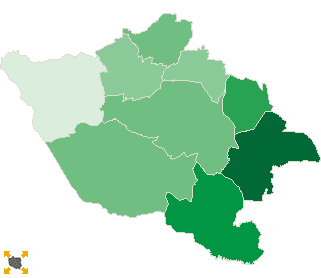
Turnout by location of ward electoral commission |
. |
. |
| . |
. |
| . |
. |
. |
. |
. |
. |
. |
. |
. |
. |
. |
. |
| No. |
Name |
No. of polling |
No. of people
entitled to vote |
No. of
ballot papers
issued |
No. of: ballot papers issued / entitled to vote [%] |
| wards |
wards which
transmitted the results |
| 1 | rural commune | 37 | 37 | 42506 | 18469 | 43.45 | |
| 2 | urban commune | 56 | 56 | 81903 | 34347 | 41.94 | |
|
|
 First ballotLegal ActsDocumentsElectoral BodiesCandidatesTurnoutResultsSearchCreated by