|
See also:
|
| . |
. |
Number of people entitled to vote, Number of ballot papers issued |
. |
. |
| . |
. |
| . |
. |
. |
. |
. |
. |
. |
. |
. |
. |
. |
. |
| No. |
Name |
No. of polling |
No. of people
entitled to vote |
No. of
ballot papers
issued |
No. of: ballot papers issued / entitled to vote [%] |
| wards |
wards which
transmitted the results |
| 120502 | Biecz, gm. | 13 | 13 | 13530 | 6208 | 45.88 |  |
| 120503 | Bobowa, gm. | 8 | 8 | 6996 | 3409 | 48.73 | |
| 120504 | Gorlice, gm. | 11 | 11 | 13066 | 6299 | 48.21 | |
| 120501 | Gorlice, m. | 22 | 22 | 24175 | 10927 | 45.20 | |
| 120505 | Lipinki, gm. | 7 | 7 | 5429 | 2433 | 44.81 | |
| 120506 | Łużna, gm. | 7 | 7 | 6432 | 2851 | 44.33 | |
| 120507 | Moszczenica, gm. | 3 | 3 | 3728 | 1585 | 42.52 | |
| 120508 | Ropa, gm. | 4 | 4 | 3902 | 2126 | 54.48 | |
| 120509 | Sękowa, gm. | 6 | 6 | 3908 | 1786 | 45.70 | |
| 120510 | Uście Gorlickie, gm. | 10 | 10 | 5566 | 2816 | 50.59 | |
| |
gorlicki |
91 |
91 |
86732 |
40440 |
46.63 |
 |
|
| |
| . |
. |
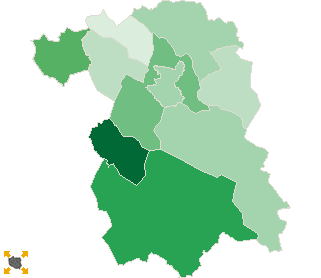
Turnout by location of ward electoral commission |
. |
. |
| . |
. |
| . |
. |
. |
. |
. |
. |
. |
. |
. |
. |
. |
. |
| No. |
Name |
No. of polling |
No. of people
entitled to vote |
No. of
ballot papers
issued |
No. of: ballot papers issued / entitled to vote [%] |
| wards |
wards which
transmitted the results |
| 1 | rural commune | 48 | 48 | 42031 | 19896 | 47.34 | |
| 2 | urban - rural commune | 21 | 21 | 20526 | 9617 | 46.85 | |
| 3 | urban commune | 22 | 22 | 24175 | 10927 | 45.20 | |
|
|
 First ballotLegal ActsDocumentsElectoral BodiesCandidatesTurnoutResultsSearchCreated by